Student Success
Student Success at SMC
Posted in compliance of HLC Policy FDCR.A.10.080
Additional Information About Student Success Charts
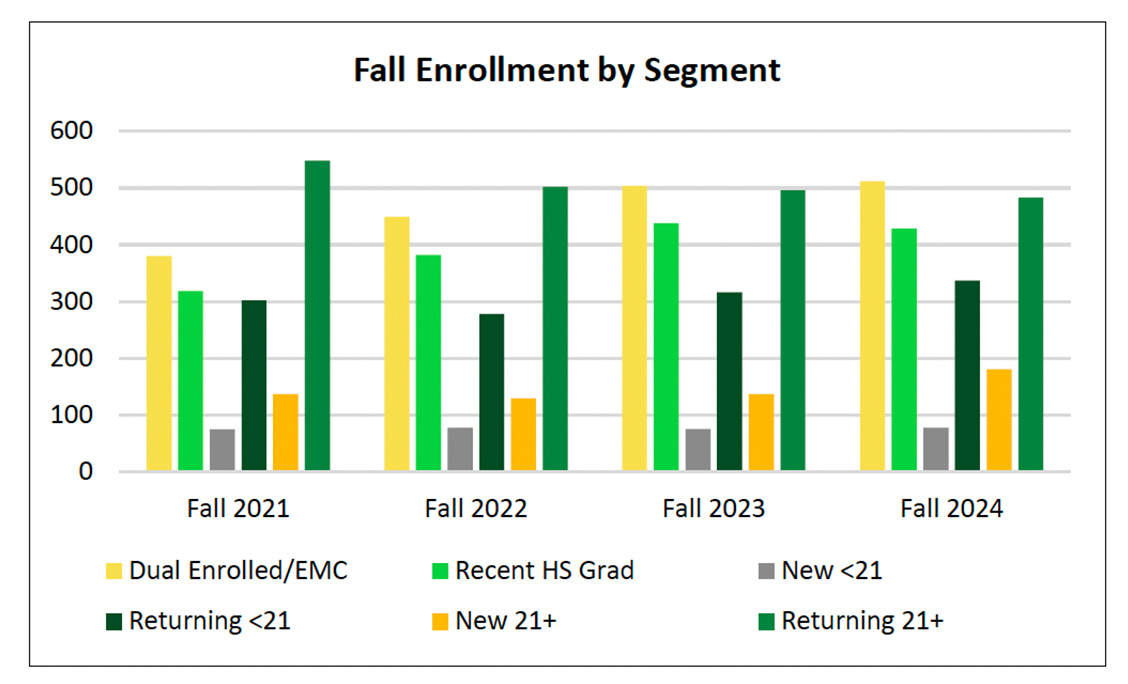
Notes: Segments started Fall 2021
Update: October 2025
Update: October 2025
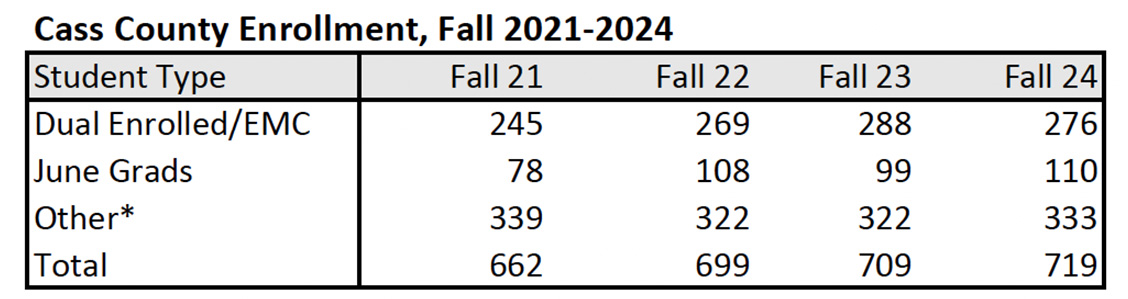
*Non-June grad FTIAC, Transfer, Returning
Cass County based on County code (not high school code)
Data Source: Preliminary Freeze
Next Update: October 2025
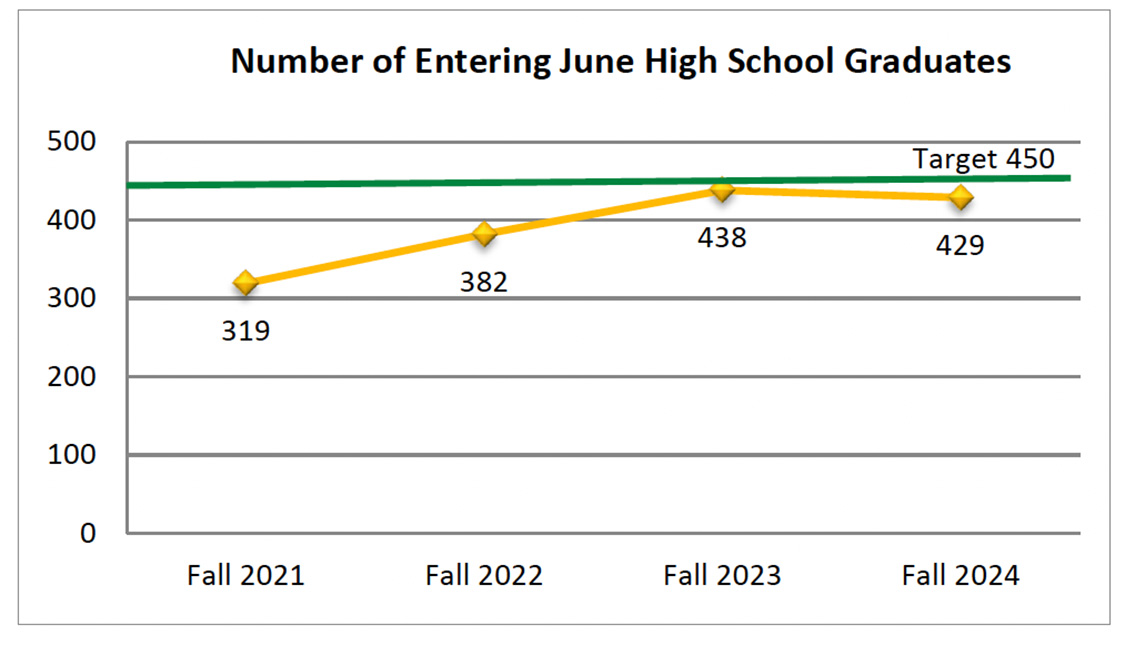
Source: ORC - June Graduates
Data Source: Preliminary Freeze
Next update: October 2025
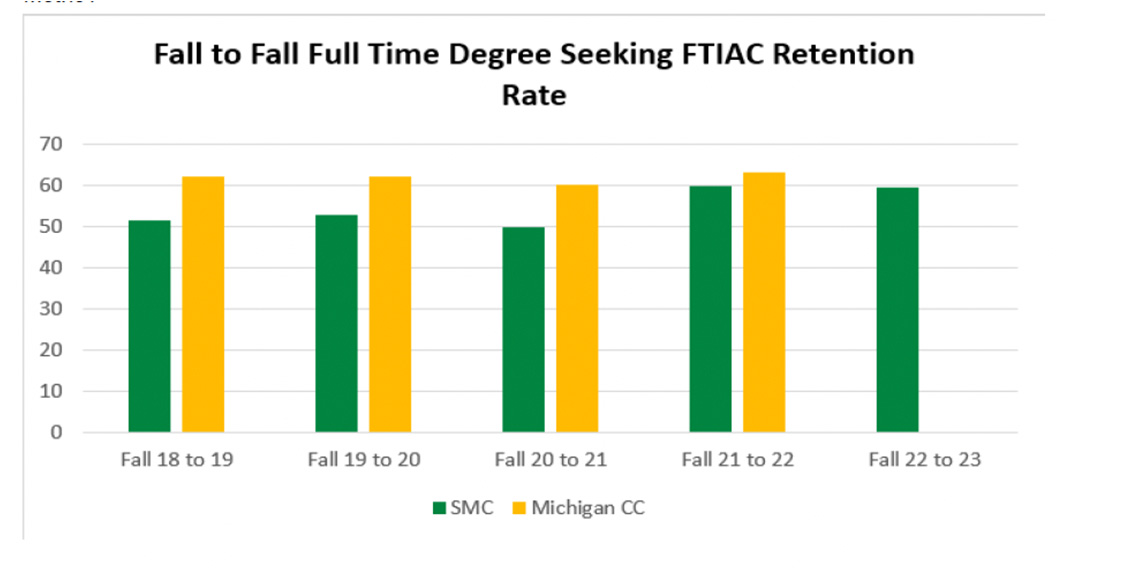
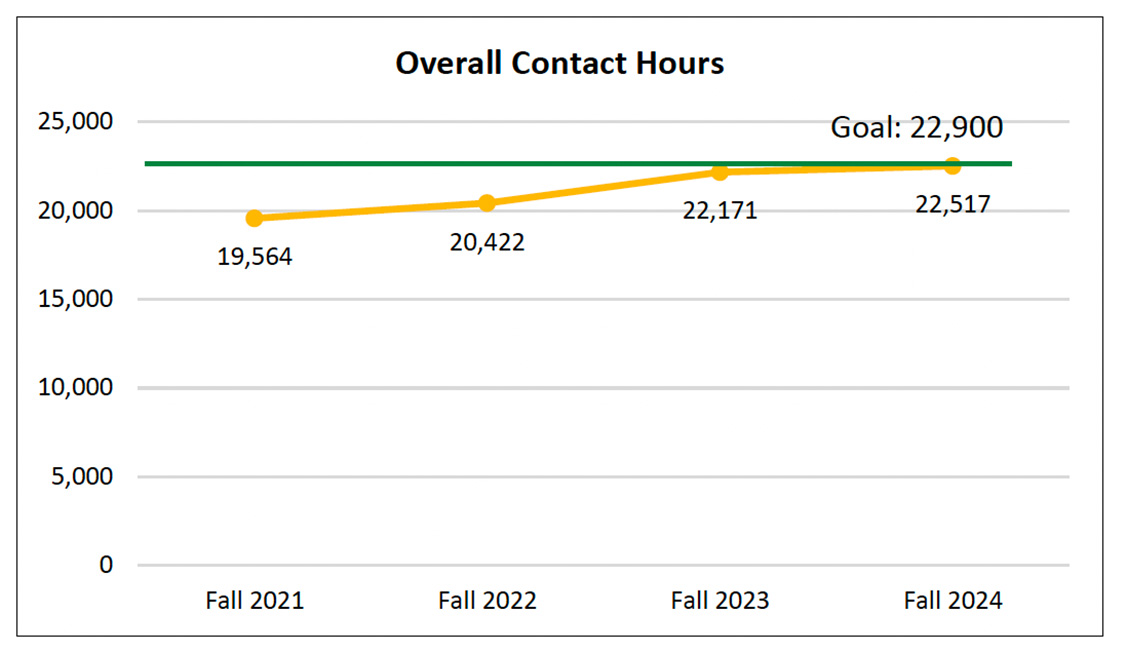
Source: IPEDS
Next update: February 2025
SMC has demonstrated consistent improvement and continues to exceed the national average in all eight measures of student satisfaction.
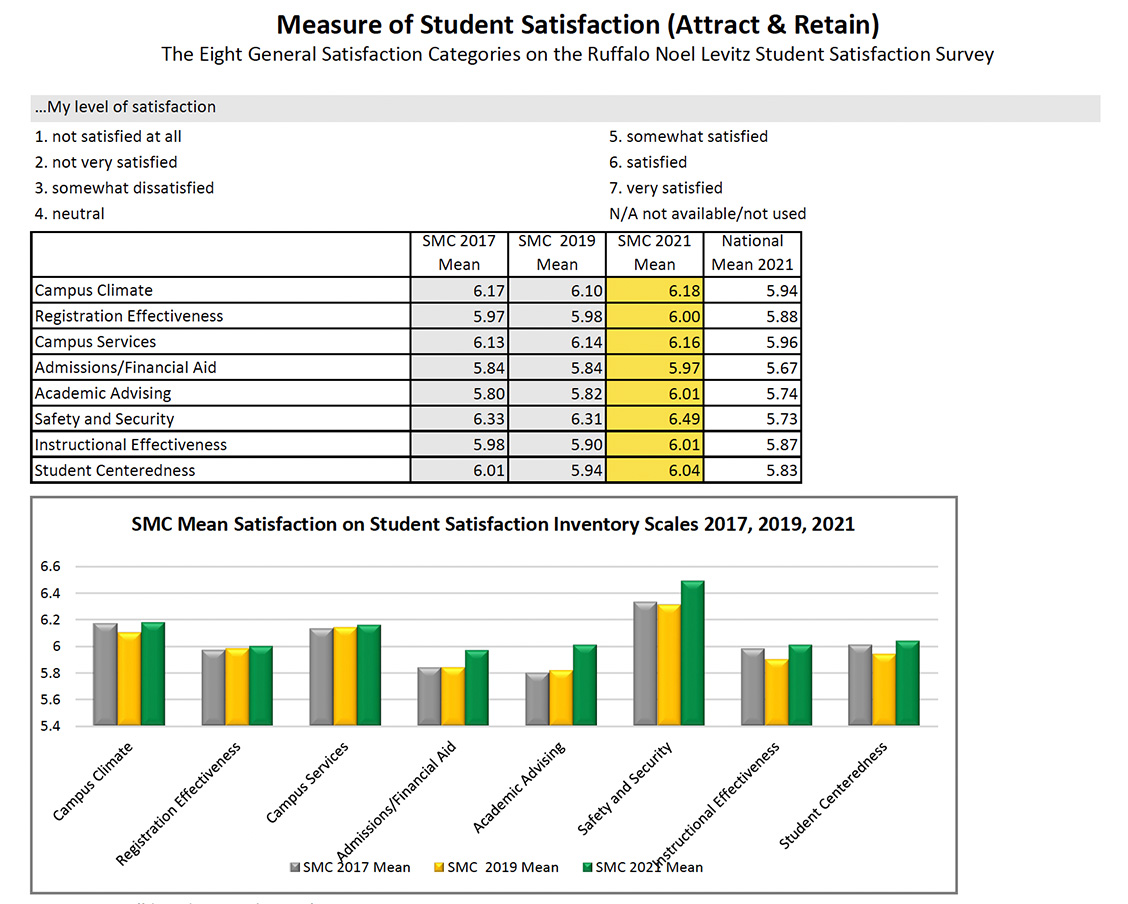
Source: Spring Ruffalo Noel-Levitz Student Satisfaction Surveys
Did not survey in 2023, Next survey 2025
SMC's graduation rate is consistently above the state average.
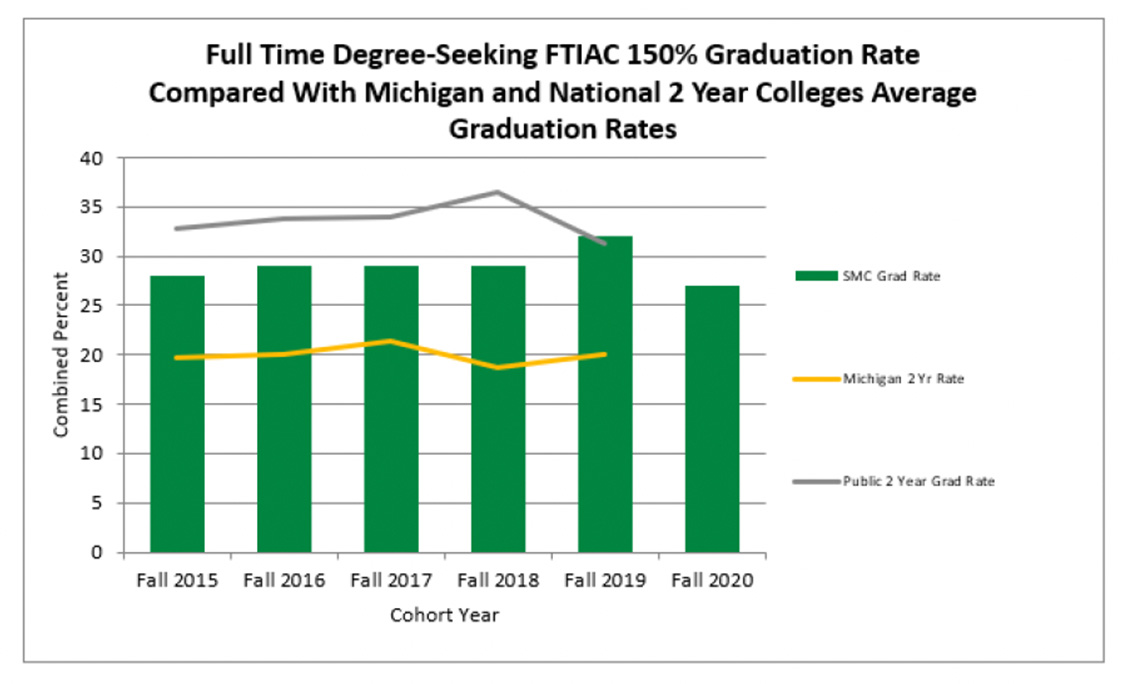
Source: IPEDS
Next update: February 2025